Fishbone Diagram
The Fishbone Diagram, also known as the Ishikawa or cause-and-effect diagram, is used to systematically analyse and visualise the root causes of a problem. It helps to identify key causes and their contributing factors, which are categorised to reveal potential starting points for solutions.
Organisation
-
Duration
Medium (about 30-60 minutes)
-
Complexity
Difficult
-
Group size
3 to 10 persons
This activity is not suitable online.
Description Long
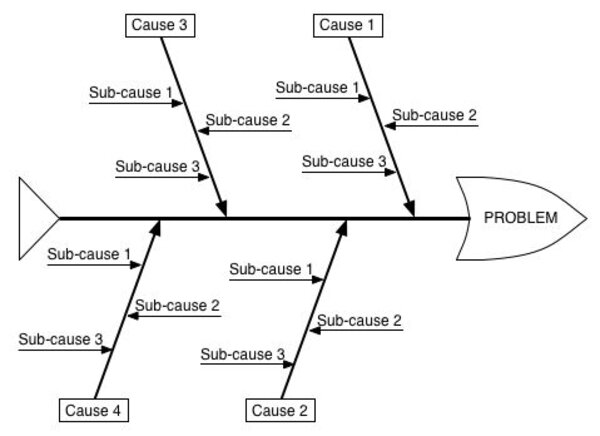
The Fishbone Diagram was developed in 1960 by Kaoru Ishikawa at the University of Tokyo to support structured problem analysis. It visualises the causes of a problem in a fishbone-like structure, where the fish’s head represents the problem and the bones represent the potential causes. The main causes are grouped into categories, such as the 6 Ms (Manpower, Machines, Methods, Materials, Measurements, Mother Nature) or the 4 Ps (Policies, Procedures, People, Plant). Each main cause can be expanded with contributing sub-factors.
Fishbone diagrams are typically drawn from right to left, with each main “bone” branching into smaller ones for the sub-causes. The method is particularly useful when combined with brainstorming, as it helps identify all possible reasons behind a problem and uncover connections between different elements. After the brainstorming session, the facilitator supports the group in organising the causes and arranging them hierarchically. This enables detailed analysis and is especially helpful for investigating root causes and developing effective solutions.
Illustration
Preparation
-
- Clearly and unambiguously define the problem to be analysed.
- Determine suitable categories (e.g. the 6 Ms) that are relevant to the problem.
- Prepare a flipchart or similar material.
Execution
- Draw a fishbone diagram with the problem stated at the head.
- Identify the main factors contributing to the issue and enter them along the ‘bones’ of the fish.
- Add sub-factors that contribute to each main factor.
- Evaluate the factors according to their importance; asking ‘why’ questions can support this process.
- Analyse and expand the diagram until there is sufficient detail to investigate change and test potential consequences.
Hints from experience
-
- Ensure that the group agrees on the purpose and wording of the “cause statement”.
- In larger groups, one possible variation of the method is to write down the causes on Post-it notes and then group similar ones together.
- Circle key terms and focus the analysis on these.
-
References
Hill, R. Cause and Effect Analysis: Identifying the Likely Causes of Problems. Mindtools.com. Retrieved 5 August 2015, from http://www.mindtools.com/pages/article/newTMC_03.htm
Ishikawa, K., & Loftus, J. (1990). Introduction to quality control. Tokyo, Japan: 3A Corporation.
Sutevski, D. (2012). Cause and Effect Analysis to Solve Business Problems. Retrieved from http://www.entrepreneurshipinabox.com/3899/cause-and-effect-analysis-to-solve-business-problems/
Wong, K. C. (2011). Using an Ishikawa diagram as a tool to assist memory and retrieval of relevant medical cases from the medical literature. Journal of medical case reports, 5(1), 120. Retrieved 5 August 2015 from, http://www.biomedcentral.com/content/pdf/1752-1947-5-120.pdf